Financial metrics are quantitative measures used to help a business with analyzing performance and also helps to convert data into actionable information about liquidity, solvency or other important knowledge that may be used to make decisions. They are used both by internal managers to improve productivity and attract investors with quantitative analytics alongside a solid business pitch.
Profitability: at the heart of your business
One of the fundamental elements of business is its profitability. In other words, how can you add value to the resources you have available in order to drive business from it? In this way, profitability is an important element to manage.
Let’s take a look at some of the metrics that are used to monitor profitability. Managing profitability can be a challenge, for example with collecting reliable data, creating insights, and taking actionable decisions. This can be quite different for various sectors. Let’s discover industry specific sectors: e-commerce, consultancy, and software as a service (SaaS).
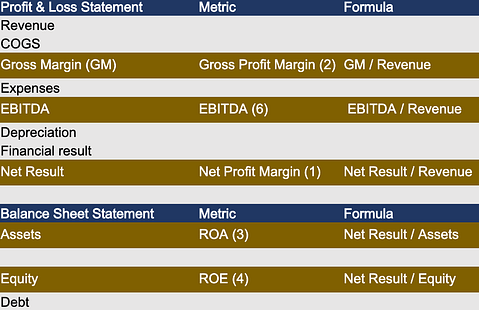
1. Net profit margin (NPM)
Reflecting the overall financial health of the company, the NPM provides an overall picture of how profitable a company is after all expenses, including interest and taxes, have been taken into account. By taking all expenses into account, NPM helps investors to assess whether a company’s management is generating sufficient profits from its sales and if operating costs and overheads are being contained.
NPM is calculated in a similar way for our three selected industry sectors. The main difference is the type of expenses driving profitability. The e-commerce sector has more costs related to the products they sell. In comparison, the consultancy sector has a much larger cost for payroll while the SaaS sector has higher IT infrastructure and development costs.
How to calculate your NPM:
net income/total revenue
- Gross profit margin (GM)
The gross profit margin, also called gross margin (GM) shows the product or service specific margin. Taking the company’s revenue, with consideration of the direct costs to produce the goods or service. In other words, the gross profit margin measures the efficiency of management to generate profit for every euro of cost.
A high gross profit margin indicates that the core activities are efficient. On the other hand, a low profit margin indicates a high cost of goods sold.
For e-commerce companies low margins could be due to unfavorable purchasing policies, low sales prices, fierce competition, or an incorrect sales promotion.
For a consultancy business, low margins might be caused by a disconnect between the price of their consultants (i.e., payroll) and the fee they charge. Often, the calculation (and allocation) of payroll costs directly related to the service can be a challenge.
For SaaS companies the gross margin is mostly high (around 80%) taking into account that their main COGS drivers are hosting and IT infrastructure. The argument that developers working on the product are COGS may be valid, and again provides a challenge to allocate payroll costs correctly. Other causes of low margin could be facing fierce competition in a crowded marketplace, an increased demand for services that require expensive infrastructure investments that cannot be passed on, or price stickiness.
How to calculate your gross profit margin:
(net sales – COGS)/net sales
(COGS: cost of goods sold)
- Return on assets ratio (ROA)
The ROA ratio specifically shows how much after-tax profit a company has generated for every euro it owns in assets. Or to look at it from a different angle, it shows how asset intensive a company is. The lower the profit per euro of assets, the more asset-intensive the company is and the larger investment they need to make to generate revenue. A higher ROA is a sign that the company is more efficient and productive when it comes to managing its balance sheet to generate profits.
This metrics is also often used for the evaluation of new capital investments for specific projects or new business lines.
Companies with an asset intensive business model tend to have a lower ROA. For example e-commerce companies with an internal production line and warehouses. Consultancy and SaaS companies usually have a higher ROA, since their resources are mainly people.
How to calculate your ROA:
net income/total assets
- Return on equity (ROE)
The ROE ratio measures the profitability of a company’s equity (capital provided by founders or investors) and how efficiently it generates that profit. Companies with a high ROE are usually better able to generate cash internally, making them less dependent on debt financing.
Investors and equity analysts are particularly interested in the ROE ratio as it expresses the return on the money invested in a company, with a favorable ROE ratio often cited as a reason to buy a company’s shares.
As the ROE ratio is dependent on the return on investment rather than its assets or other liability, it tends to vary from company to company instead of from sector to sector. The capital structure of a company is an important element of this metric.
How to calculate your ROE:
net income/total equity
- Return on investment (ROI)
When it comes to effectively allocating capital to profitable investments, how does a company measure up? The ROI ratio generates a figure that can be benchmarked against other companies. It can also be used to generate insights about the value a company creates by looking to see if its ROI is higher than its weighted average cost of capital (WACC).
This metric can also be applied to specific investment cases, departments within a company or investment related projects.
Like the ROE ratio, this varies depending on management decisions as well as the business situation, so has more variation within each sector.
How to calculate your ROIC:
NOPAT/invested capital = EBIT x (1 – tax rate / (value of debt + value of equity)
(NOPAT: net operating profit after tax; EBIT: earnings before interest and taxes)
- Earnings before interest, taxes, depreciation, and amortization (EBITDA)
EBITDA represents the profitability of a company before non-operating items (e.g., interest and taxes) and non-cash items (e.g., depreciation and amortization) are taken into consideration. It is a useful metric as it excludes expenses that are not directly related to the operational profitability of the company. Costs from debt (interest) and investments (depreciation) are strategic decision and don’t relate to the operational efficiency.
It is widely used in many valuation methods as it provides a clear picture of the company’s value which can be shown to potential investors or used by potential buyers to calculate the multiple. It can also be used as a shortcut to estimate the cashflow available to pay off long-term asset liabilities.
How to calculate your EBITDA:
net income + taxes + interest expense + depreciation + amortization
- Industry specific metrics
In addition to general profitability metrics that are suitable for most, if not all, sectors, there are also industry specific metrics. We cover some metrics that are applicable for our selected sectors:
- E-commerce: the profitability per shipment is a useful metric to determine the added value of different shipment types, which could influence future business decisions.
- Consultancy: as the payroll makes up a large proportion of the company’s costs, the revenue per full-time equivalent (FTE) is vitally important. This enables the company to ensure that the profit generated per FTE stays at a healthy level. The profitability margin per project also needs to be monitored to check that the right resources are being used for each project.
- SaaS: there are a number of useful metrics for the SaaS sector (see our previous blog).
How liquidity metrics can make the difference when it comes to growth
Companies want to expand their operations, grow into new markets, and serve new customers without compromising their profitability. To achieve this, you need to balance you cash in- and outflows by managing your liquidity. But how can you boost the financial health of your company to give it the best opportunity for growth?
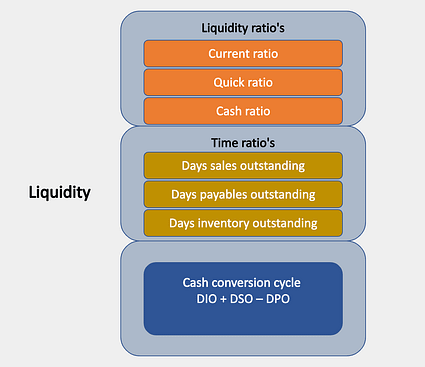
Using metrics to measure your liquidity will help you to follow up your cash health and give you insights on how to improve it. Let’s take a look at some useful liquidity metrics and see the benefits they offer.
1. Current ratio
Also known as working capital ratio
Including all current assets and liabilities, the current ratio measures your company’s ability to pay short-term liabilities or obligations (within a year). It shows investors how your company can maximize your current assets to meet your current liabilities. It is worth noting that the current ratio only gives a snapshot into your finances, so doesn’t give a complete reflection of your short-term liquidity or longer-term solvency.
A current ratio in line with or slightly above the industry average is considered acceptable, while a lower ratio may indicate a higher risk of distress or default. However, if the current ratio is significantly higher than the industry average, it indicates that management might not be using its assets efficiently.
How to calculate your current ratio:
current assets / current liabilities
2. Quick ratio
Also known as the acid test
The quick ratio is an indicator of your company’s short-term liquidity position and measures your company’s ability to meet your short-term obligations with your most liquid assets, without selling stock or obtaining additional financing. The higher the ratio, the better the company’s liquidity and financial health.
As the quick ratio does not include inventory, which is difficult to turn into cash in the short term, it is considered more conservative than the current ratio.
How to calculate your quick ratio:
(current assets – inventory – prepaid expenses) / current liabilities
3. Cash ratio
The cash ratio tells creditors and analysts the value of your company’s current assets that can be quickly converted into cash and what percentage of your company’s current liabilities these cash and near-cash assets can cover. It is useful for creditors when deciding how much money they might be willing to lend to your company.
The results can be a cash ratio of 1 (the company has the same amount of current liabilities and cash), less than 1 (the company has insufficient cash to pay all current liabilities), or more than 1 (the company will have cash over after paying all current liabilities).
How to calculate your cash ratio:
(cash + cash equivalents) / short-term liabilities
4. Days sales outstanding (DSO)
Also known as days receivables or average collection period
How long does it take your company, on average, to collect payment for a sale? The answer is your DSO. Calculated on a monthly, quarterly, or annual basis, companies aim to receive payments quickly to keep their DSO as low as possible and ensure a smooth cashflow. Generally, a DSO of less than 45 days is considered low.
How to calculate your DSO:
(receivables/total sales) x days
5. Days payables outstanding (DPO)
As the opposite of DSO, DPO monitors the average time taken (in days) for your company to pay your suppliers, vendors, or financiers. Measured on a quarterly or annual basis, DPO indicates how well your company’s cash outflows are managed.
There are pros and cons to having a higher DPO. On one hand, it enables you to hold onto funds for longer so you can maximize benefits, increase your working capital, and free cash flow. But on the other hand, it can also be a red flag, indicating an inability to pay bills on time.
How to calculate your DPO:
(accounts payable x days) x cost of goods sold
6. Days Inventory Outstanding (DIO)
Also known as days sales of inventory.
The DIO indicates the average time taken for your company to convert your inventory, including works in progress, into sales. In other words, it shows how long your company’s cash is tied up in inventory and how long the inventory will last. While the average DIO varies from industry to industry, a lower DIO is preferred as it indicates that it will take less time to clear inventory.
How to calculate your DIO:
(average stock / cost of goods sold) x 365
7. Cash conversion cycle (CCC)
CCC measures the time lag between the purchase of your company’s inventory and the receipt of cash from accounts receivable. By looking at how long your company’s cash remains tied up in your operations you can see how efficiently your managers manage your working capital.
A longer CCC means it will take longer to generate cash, which can mean insolvency for small businesses. A shorter CCC is a sign of a healthy company as it can use the extra cash to make additional purchases or pay off outstanding debts.
How to calculate your CCC:
DIO + DSO – DPO
days inventory outstanding + days sales outstanding – days payables outstanding
What you need to know about net working capital and its importance for your company
Managing your cash inflows and outflows, is vital for all companies whether they have expansion or re-organization plans. A large amount of cash can be taken up by the working capital. You may need to give your clients decent payment terms, maintain a certain inventory to service clients, and pay your suppliers in a timely manner. However, it is not always straightforward to manage those cashflows efficiently.
Let’s take a look at the net working capital in more detail.
Net working capital (NWC)
NWC measures a company’s liquidity, operational efficiency, and short-term financial health, providing an insight into the company’s overall liquidity and its ability to pay its short-term debts.
A positive NWC indicates that a company can finance its current operations and invest in future operations and growth, while a negative NWC shows that the current ratio is less than 1 which means the company may have difficulty growing or paying back creditors.
However, a high NWC is not always positive as it can indicate that the company has too much stock or is not investing its excess cash. To avoid this, it’s important to monitor and manage your NWC carefully, but depending on your industry sector, this can be capital-intensive to do.
Every sector is different, and the relevance and importance of NWC on your company depends on various factors.

An important factor is the average deal size. Businesses with larger deal sizes tend to give longer payment terms or refer to periodic invoicing for collecting cash. This is often the case for a consultancy business or B2B SaaS business. While resources (service of employees) are provided and payment by clients will be performed afterwards, this can lead to a temporary cash need, or phrased differently, a working capital need.
It is less relevant for sectors with a small deal size, such as B2C e-commerce companies, because payment often happens immediately.
For a B2C SaaS business, giving the customer the option to pay 12 months upfront, can be a powerful way to create a positive effect on the cash balance.
How to calculate your NWC:
current assets – current liabilities (broad definition)
accounts receivable + inventory – accounts payable (narrow definition)
Important elements for calculating NWC
- Accounts receivable: this can be measured using the days sales outstanding (DSO) metric.
- Inventory: this can be measured using the days sales of inventory (DSI) metric which is also known as the days inventory outstanding (DIO) metric. Alternatively, this can be done by counting the number of products in inventory using price-volume metrics. In order to use these metrics, your inventory must be clear and identifiable. Inventory is only included in the NWC for product-related companies.
- Accounts payable: similarly, this can be measured using the days payables outstanding (DSO) metric. This metric should be monitored closely to ensure you pay invoices on time, but not too early or late, to optimize your cashflows.
Three aspects of NWC are working capital requirement (WCR), cash burn, and cash runway.
- Working capital requirement (WCR)
WCR is the amount of money required to keep the company’s operations going (or expanding) by covering the gap between accounts receivable, accounts payable and inventory. The larger this gap is, the less flexibility and capital you have available to seize opportunities, such as expanding your product line to meet new demand. When calculating your WCR, it is important to plan for late payments from some customers to ensure that your WCR is realistic.
The efficiency of your working capital can be calculated using the cash conversion cycle (CCC) metric.
- Cash burn
The cash runway calculates how long the company can continue to operate at the current cash burn rate before they run out cash reserves and would need to raise additional capital. It can be used to highlight potential overspending, for example if the cash runway shrinks from one quarter to the next. Together with the cash burn rate, the cash runway is especially useful to track growth and profitability in startups.
The cash burn rate looks at the amount of money a company spends per month, in other words, it measures the negative cashflow. There are two variations of cash burn: net burn and gross burn. Gross burn is the total amount of expenditure the company has per month, while net burn also includes revenues.
When you are growing a company from scratch it is likely that it is not profitable for a significant period of time. To prepare for investments planning, and importantly manage the cash need, the cash burn is most relevant.
How to calculate your net cash burn:
Revenue – monthly operating expenses = net burn rate
Cash/monthly operating expenses = gross burn rate
- Cash runway
How to calculate your cash runway in months:
Total cash/monthly cash burn rate (gross or net)
What solvability tells your (potential) investors about your company
There are a lot of reasons for an investor to get involved in a particular project. He could like the company, be astounded by the product, or be impressed by the management team. However, underlying all these reasons is the investor’s desire to grow their investment. To achieve this, investors investigate opportunities from a variety of angles, with a particular focus on the company’s solvability metrics.
Unlike liquidity metrics that focus on the company’s capacity to pay short-term commitments, solvability metrics take a longer view by showing the company’s ability to meet its long-term financial obligations. By tracking solvability metrics, the company is in a better position to take strategic financial decisions based on valid information.
Good solvability can also convince investors about the benefits of investing in a particular company. For example, inflation has a knock-on effect, increasing interest rates which makes capital more expensive and leads to the contraction in the amount of available capital. When this happens, investors prefer to invest in companies with good solvability to ensure their returns instead of a high-risk, high-return option.
Let’s take a look at some solvability metrics and what they mean for your company.

- Debt-to-equity ratio (D/E ratio)
The debt-to-equity ratio is used to evaluate a company’s financial leverage, reflecting the capacity of shareholders’ equity to cover all outstanding liabilities in the event of a business downturn. Higher leverage ratios usually indicate a company or stock with a higher risk for shareholders and (potential) investors as it indicates that company is financing a large amount of its growth through borrowing.
How to calculate your D/E ratio:
total liabilities / total shareholders’ equity
- Debt-to-assets ratio (D/A ratio)
By considering all the company’s liabilities, such as loans, bonds payable, and all assets, including intangible assets, the debt-to-asset ratio indicates the company’s financial stability. The higher the ratio, the higher the degree of leverage, which means the higher the risk of investing in the company.
To give an example, if a company has a ratio of 0.4, then 40% of its assets are financed by creditors and the other 60% by equity. This is a useful metric to see how much debt the company already has and whether the company can repay its existing debts.
How to calculate your D/E ratio:
total liabilities / total assets
- Interest coverage ratio (IC ratio)
The interest coverage ratio is used to determine how easily a company can pay the interest on its outstanding debt as being able to pay interest payments is a critical and ongoing concern for any business. Once a company struggles to meet its obligations, it may be forced to borrow further or draw on its cash reserve, which would be better used to invest in capital assets or for emergencies.
The IC ratio is often used by lenders, investors, and creditors to determine the risk of a company based on its current debt or for future loans or investments. Generally, a higher ratio is better.
How to calculate your D/E ratio:
earnings before interest and taxes (EBIT) / interest expense
Talk to the experts
It’s important to remember that it costs money to borrow capital, whether that’s in the form of investment or loans. The costs of this capital could be interest payments, in-kind agreements, strategic concessions, or a liability in another form. Contact CFOrent to ensure reliable calculation of your solvability ratios to generate the capital your company needs to grow.
Contact us for more information.
This blog is related to our previous mini-series regarding sales and marketing. Take a look at the sales and marketing blogs!
