Profitability: at the heart of your business
This article is part 1 of the metrics mini-serie on financial metrics.
One of the fundamental elements of business is its profitability. In other words, how can you add value to the resources you have available in order to drive business from it? In this way, profitability is an important element to manage.
Let’s take a look at some of the metrics that are used to monitor profitability. Managing profitability can be a challenge, for example with collecting reliable data, creating insights, and taking actionable decisions. This can be quite different for various sectors. Let’s discover industry specific sectors: e-commerce, consultancy, and software as a service (SaaS).
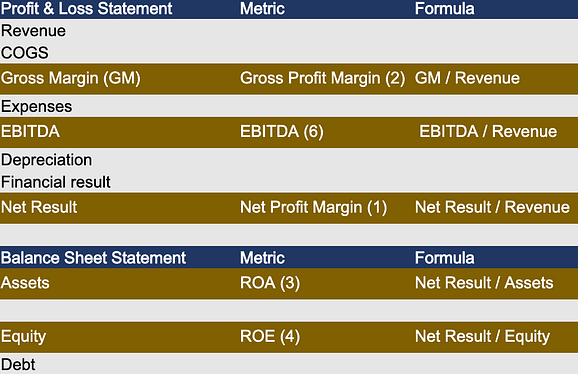
- Net profit margin (NPM)
Reflecting the overall financial health of the company, the NPM provides an overall picture of how profitable a company is after all expenses, including interest and taxes, have been taken into account. By taking all expenses into account, NPM helps investors to assess whether a company’s management is generating sufficient profits from its sales and if operating costs and overheads are being contained.
NPM is calculated in a similar way for our three selected industry sectors. The main difference is the type of expenses driving profitability. The e-commerce sector has more costs related to the products they sell. In comparison, the consultancy sector has a much larger cost for payroll while the SaaS sector has higher IT infrastructure and development costs.
How to calculate your NPM:
net income/total revenue
- Gross profit margin (GM)
The gross profit margin, also called gross margin (GM) shows the product or service specific margin. Taking the company’s revenue, with consideration of the direct costs to produce the goods or service. In other words, the gross profit margin measures the efficiency of management to generate profit for every euro of cost.
A high gross profit margin indicates that the core activities are efficient. On the other hand, a low profit margin indicates a high cost of goods sold.
For e-commerce companies low margins could be due to unfavorable purchasing policies, low sales prices, fierce competition, or an incorrect sales promotion.
For a consultancy business, low margins might be caused by a disconnect between the price of their consultants (i.e., payroll) and the fee they charge. Often, the calculation (and allocation) of payroll costs directly related to the service can be a challenge.
For SaaS companies the gross margin is mostly high (around 80%) taking into account that their main COGS drivers are hosting and IT infrastructure. The argument that developers working on the product are COGS may be valid, and again provides a challenge to allocate payroll costs correctly. Other causes of low margin could be facing fierce competition in a crowded marketplace, an increased demand for services that require expensive infrastructure investments that cannot be passed on, or price stickiness.
How to calculate your gross profit margin:
(net sales – COGS)/net sales
(COGS: cost of goods sold)
- Return on assets ratio (ROA)
The ROA ratio specifically shows how much after-tax profit a company has generated for every euro it owns in assets. Or to look at it from a different angle, it shows how asset intensive a company is. The lower the profit per euro of assets, the more asset-intensive the company is and the larger investment they need to make to generate revenue. A higher ROA is a sign that the company is more efficient and productive when it comes to managing its balance sheet to generate profits.
This metrics is also often used for the evaluation of new capital investments for specific projects or new business lines.
Companies with an asset intensive business model tend to have a lower ROA. For example e-commerce companies with an internal production line and warehouses. Consultancy and SaaS companies usually have a higher ROA, since their resources are mainly people.
How to calculate your ROA:
net income/total assets
- Return on equity (ROE)
The ROE ratio measures the profitability of a company’s equity (capital provided by founders or investors) and how efficiently it generates that profit. Companies with a high ROE are usually better able to generate cash internally, making them less dependent on debt financing.
Investors and equity analysts are particularly interested in the ROE ratio as it expresses the return on the money invested in a company, with a favorable ROE ratio often cited as a reason to buy a company’s shares.
As the ROE ratio is dependent on the return on investment rather than its assets or other liability, it tends to vary from company to company instead of from sector to sector. The capital structure of a company is an important element of this metric.
How to calculate your ROE:
net income/total equity
- Return on investment (ROI)
When it comes to effectively allocating capital to profitable investments, how does a company measure up? The ROI ratio generates a figure that can be benchmarked against other companies. It can also be used to generate insights about the value a company creates by looking to see if its ROI is higher than its weighted average cost of capital (WACC).
This metric can also be applied to specific investment cases, departments within a company or investment related projects.
Like the ROE ratio, this varies depending on management decisions as well as the business situation, so has more variation within each sector.
How to calculate your ROI:
NOPAT/invested capital = EBIT x (1 – tax rate / (value of debt + value of equity)
(NOPAT: net operating profit after tax; EBIT: earnings before interest and taxes)
- Earnings before interest, taxes, depreciation, and amortization (EBITDA)
EBITDA represents the profitability of a company before non-operating items (e.g., interest and taxes) and non-cash items (e.g., depreciation and amortization) are taken into consideration. It is a useful metric as it excludes expenses that are not directly related to the operational profitability of the company. Costs from debt (interest) and investments (depreciation) are strategic decision and don’t relate to the operational efficiency.
It is widely used in many valuation methods as it provides a clear picture of the company’s value which can be shown to potential investors or used by potential buyers to calculate the multiple. It can also be used as a shortcut to estimate the cashflow available to pay off long-term asset liabilities.
How to calculate your EBITDA:
net income + taxes + interest expense + depreciation + amortization
- Industry specific metrics
In addition to general profitability metrics that are suitable for most, if not all, sectors, there are also industry specific metrics. We cover some metrics that are applicable for our selected sectors:
- E-commerce: the profitability per shipment is a useful metric to determine the added value of different shipment types, which could influence future business decisions.
- Consultancy: as the payroll makes up a large proportion of the company’s costs, the revenue per full-time equivalent (FTE) is vitally important. This enables the company to ensure that the profit generated per FTE stays at a healthy level. The profitability margin per project also needs to be monitored to check that the right resources are being used for each project.
- SaaS: there are a number of useful metrics for the SaaS sector (see our SaaS blog).
Talk to the experts
How do your profitability metrics measure up to your industry’s norms? And is there a way to improve your results to increase your profit margins? Contact CFOrent for expert help and insights on measuring, monitoring, and improving your profitability metrics to take your company to the next level.
This is the first article in a four-part blog series on metrics in financial metrics. Click here to read part 2 on liquidity, part 3 on net working capital and part 4 on solvability.
